Interactive Map – What Has Been Achieved? (Week 3)
Want to follow my final year projects development progress? Then look no further – this is week three!
Overview
This week has probably been my most productive and gratifying week to date!
I’ve hit a point in my project design where a huge chunk of my project has reached partial completion which is going to enable me to really focus on the next set of tasks and start to pull all the individual working aspects of the project into one – excited isn’t the word and I can now start to design and implement the User Interface Design, woo!
What Has Been Achieved?
Twitter API
So much has been achieved this week with the Twitter API. To start with I have been able to re-style/code the twitter feed results so that they are being pushed through JQuery, rather than static html div elements placed in the body, this has allowed for faster page loading and a more dynamic approach to how the content is produced and presented.
Loop tweet results
In addition to this I have also managed to loop the tweet results using PHP and JQuery. This has allowed me to prepare the framework for each individual tweet result, I’ve done this part in stages so as to break everything down into manageable chunks – the next stage is to make each looped result a unique tweet result.

Twitter API – Tweet Results For Each Loop
Loop unique tweet results
Once the twitter result was being looped successfully I was able to adapt the JSON results and PHP loop to include all the results and to loop through them until there were none left to loop through. This has presented me with a stream of information relative to the current map location.
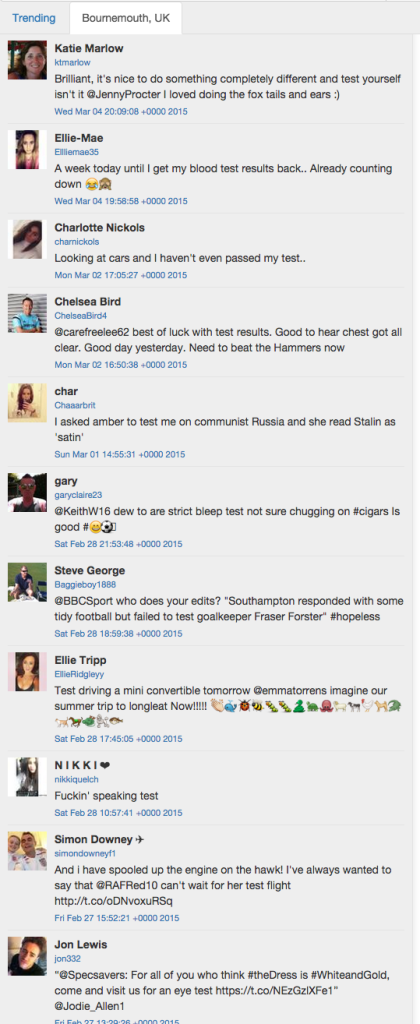
Twitter API – Tweet Results For Each Loop All Results
Trends
The popular trends sidebar has started to be implemented, so far I have managed to get the trends for a hard-coded location to display and the next step is to get the trends to update and change depending on the map location – like with the location conversation – and to also change the colour of each trend to suit a hot (red) to cold (blue) gradient effect for when the heat map is implemented.
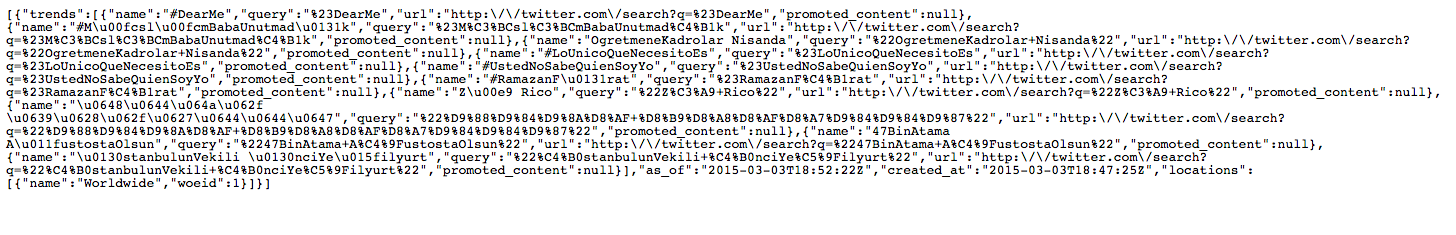
Twitter API – Trends Results
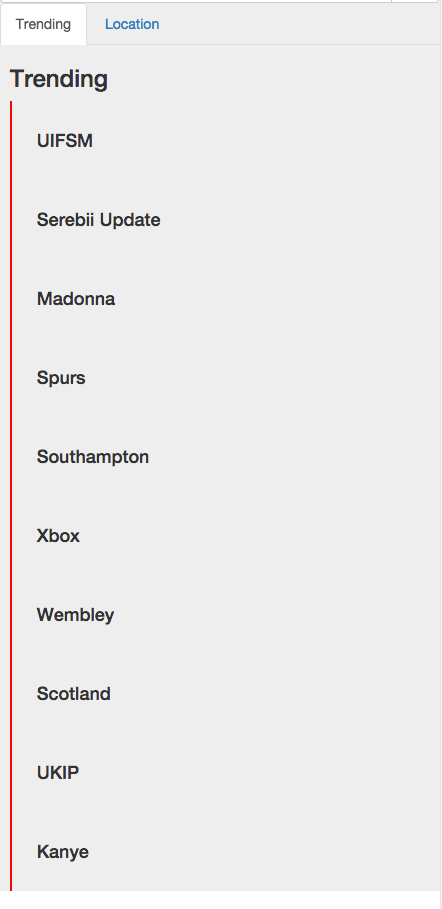
Twitter API – Trend Styled Results
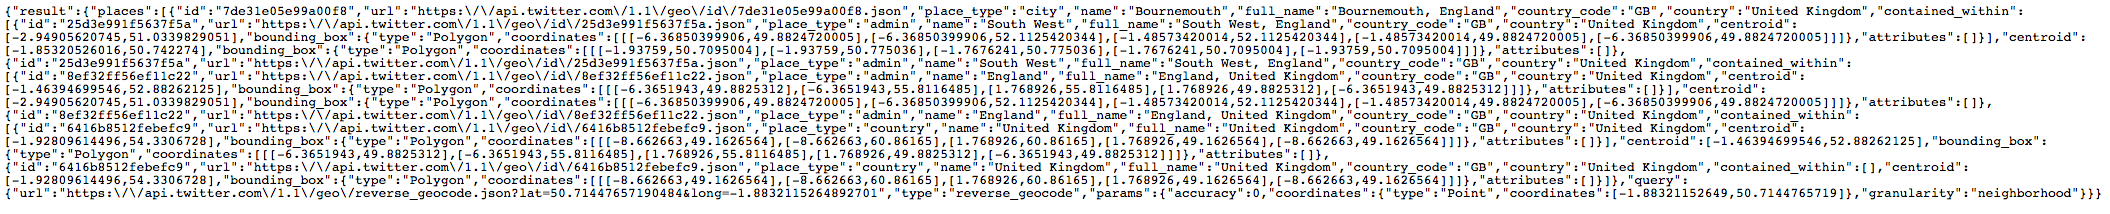
Reverse Geocode
Because I need the location name/map name to be in conjunction with the Twitter location I have decided the best way to show the map and conversation location is to use Twitters own interpretation of what latitude and longitude represents what place. This has been done by taking the latitude and longitude and using the Reverse Geocode API feature to reverse the location to give a designated and definitive location.
As this is coming through Twitter it should help to identify areas of importance and give a more unique and precise location for tweets and conversations thus allowing users to understand and acknowledge those areas in more intricate detail.
![]()
Google Map API
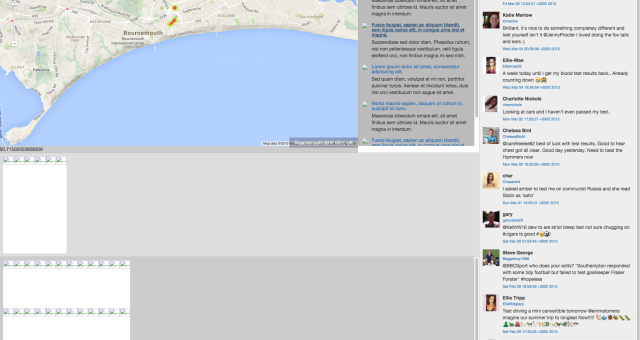
Google Map syncing with Twitter – Bournemouth
The map location and twitter conversation synchronising together to present the current conversation for the given maps longitude and latitude – this shows Bournemouth’s conversation.
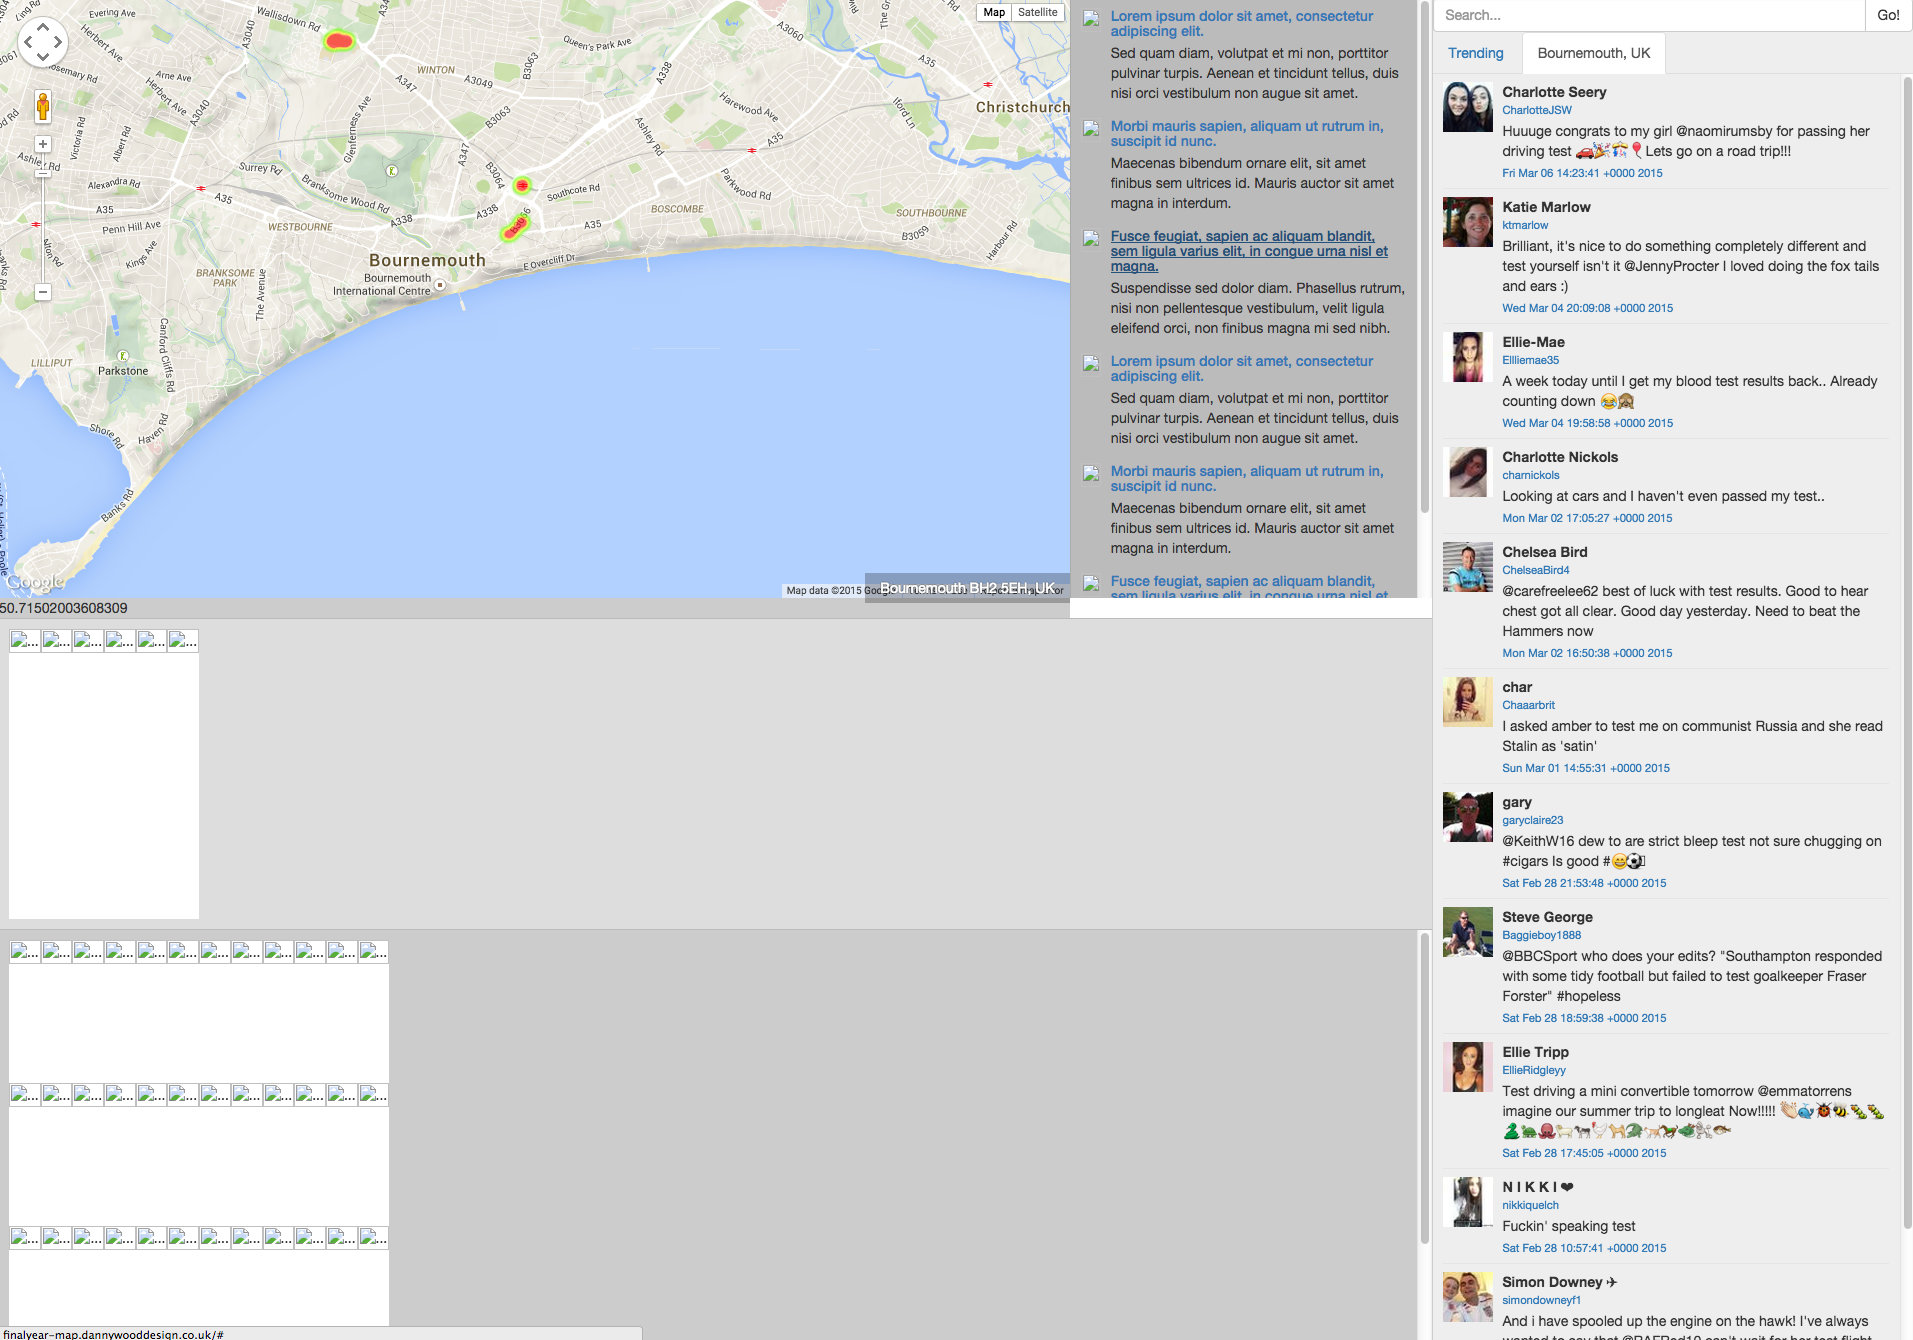
Google Map API And Twitter API Connected – Bournemouth
Google Map syncing with Twitter – London
The map location and twitter conversation synchronising together to present the current conversation for the given maps longitude and latitude – this shows London’s conversation.
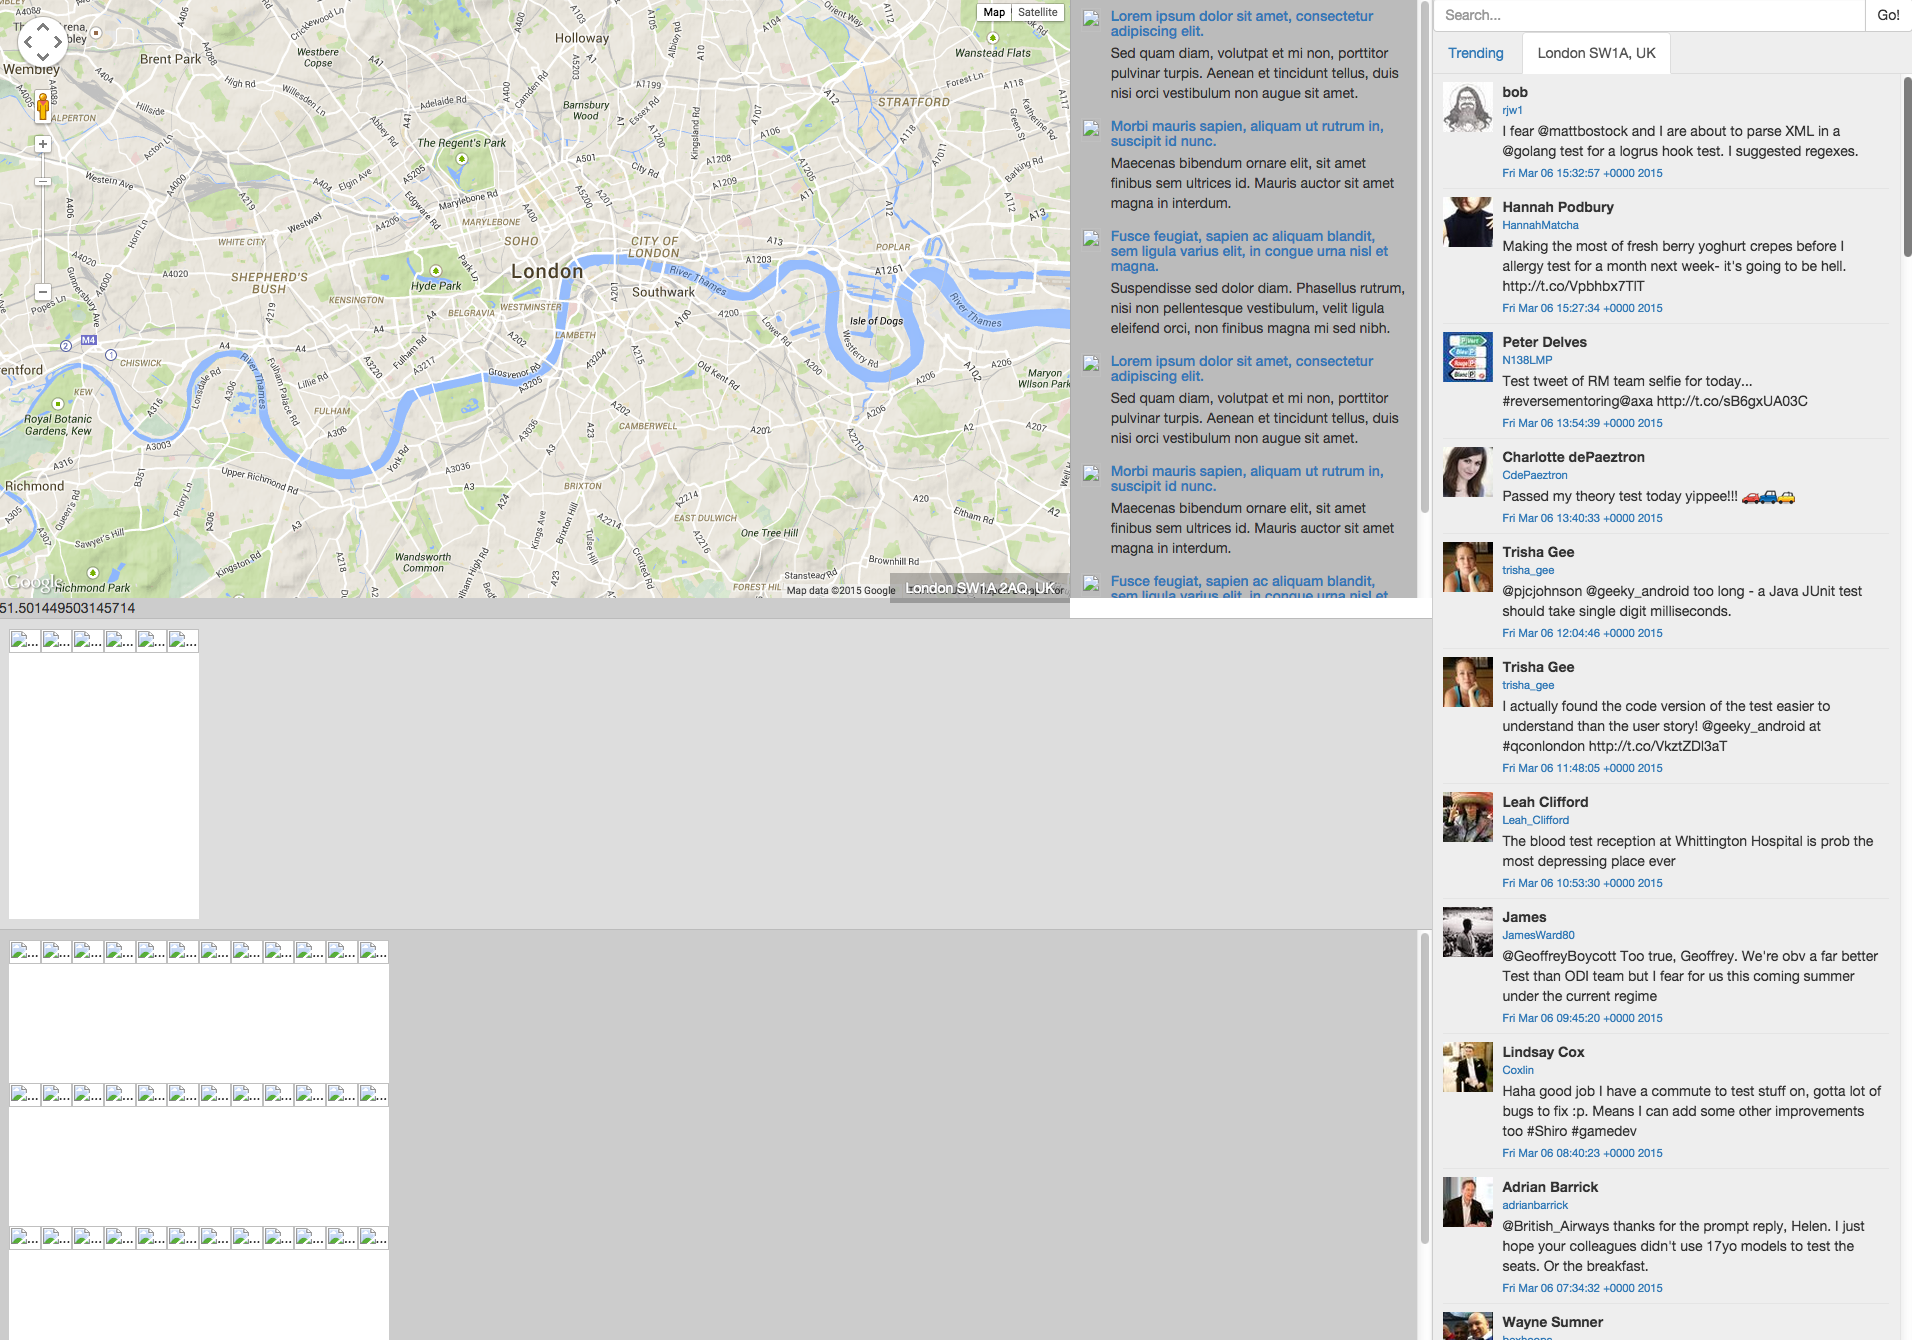
Google Map API And Twitter API Connected – London
What Bugs Have Been Found?
- Rate limit exceeded which restricts the twitter results and the amount of requests that can be made – Twitter API – solution = cache the results in the browser as soon as the user logs onto the sight and then request the Twitter API multiple times.
- Manage to break what will be the layout for the image stream and popular images – this can’t be more than just poor css or html coding.
- It appears that all of the tweet results that are coming in from the Twitter API have a common similarity of having the word “test” in the tweet. I’ve only just noticed it, but it shouldn’t be anything too difficult to overcome and solve.
What Are The Next Set of Tasks?
- Customise the Google Map – I’m considering one of the following overlays.
- Get the current twitter trends for the current maps Geo Location.
- Style the trends with a coloured gradient.
- Select tweets with only media content for the popular images and image/media stream.
- Start to design and implement the User Interface Design
- Look at product branding